Every extra foot a material, product, or person travels is a recurring cost — in labor, in time, in errors. Flow analysis maps how material, people, and equipment actually move, not how they're assumed to.
Most facilities have a rough mental model of how product moves through them: it goes in the dock, down this aisle, through that line, out the other dock. In practice, it rarely runs that clean. Flow analysis traces the actual movement of every product, part, and person — not the simplified version everyone assumes is happening.
That distinction matters more than it sounds like it should. On one recent engagement, a production line that every stakeholder assumed ran in a simple straight line turned out, once actually mapped, to be anything but. You can't fix a bottleneck you've mis-modeled, and you can't shorten a travel path you never measured in the first place.
Throughput is below where it should be, travel distances feel excessive, or you're redesigning a process and want the layout to support it rather than constrain it.
Every move of one product and its parts through a facility can be mapped in full — not assumed. In one engagement, a production line every stakeholder had assumed ran in a simple straight line turned out, once traced, to be far more tangled. Flow you haven't mapped is flow you can't improve.
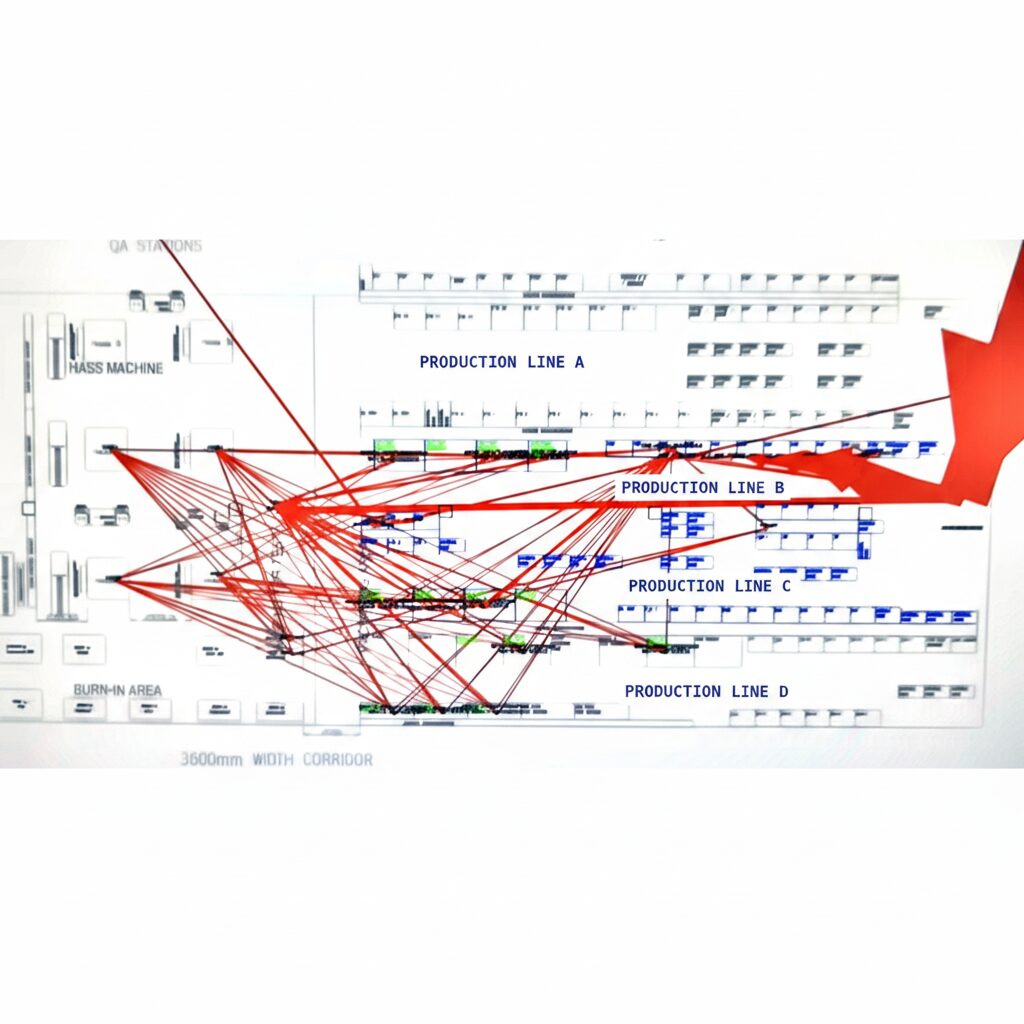
Production line detail: every path traced station to station — far more tangled than the mental model anyone starts with.
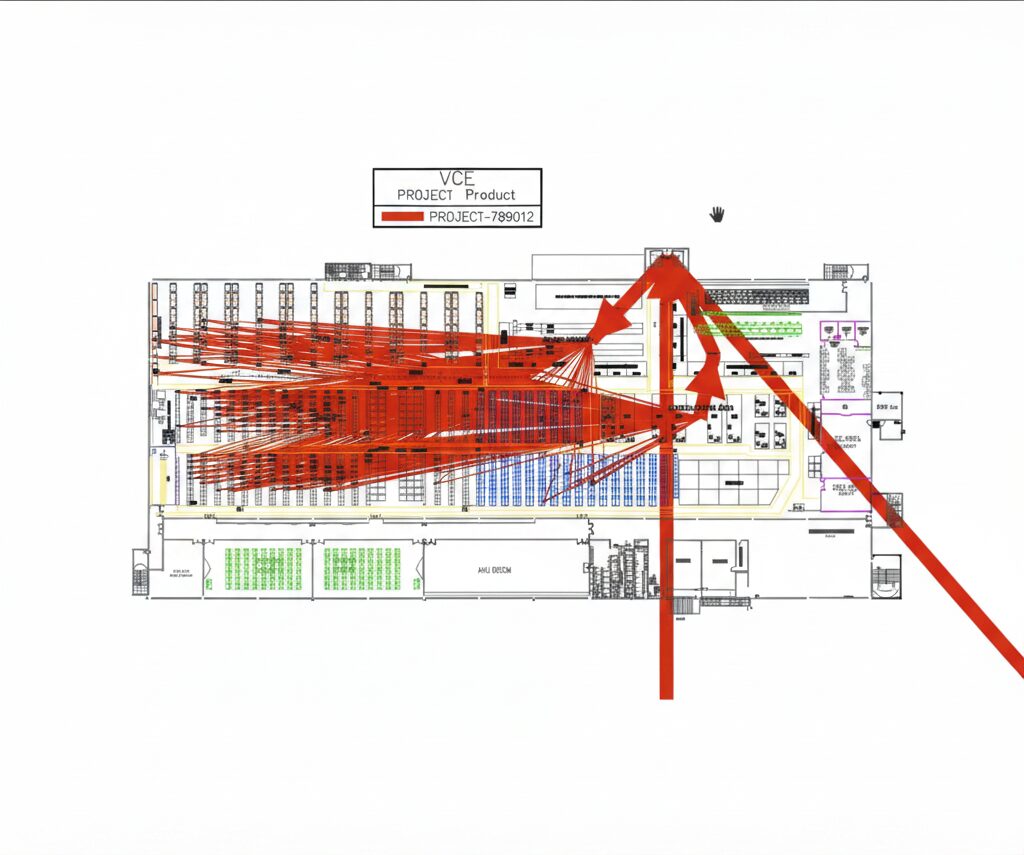
Facility-wide view: the same traced movement, zoomed out across the full footprint — the version leadership had never seen.
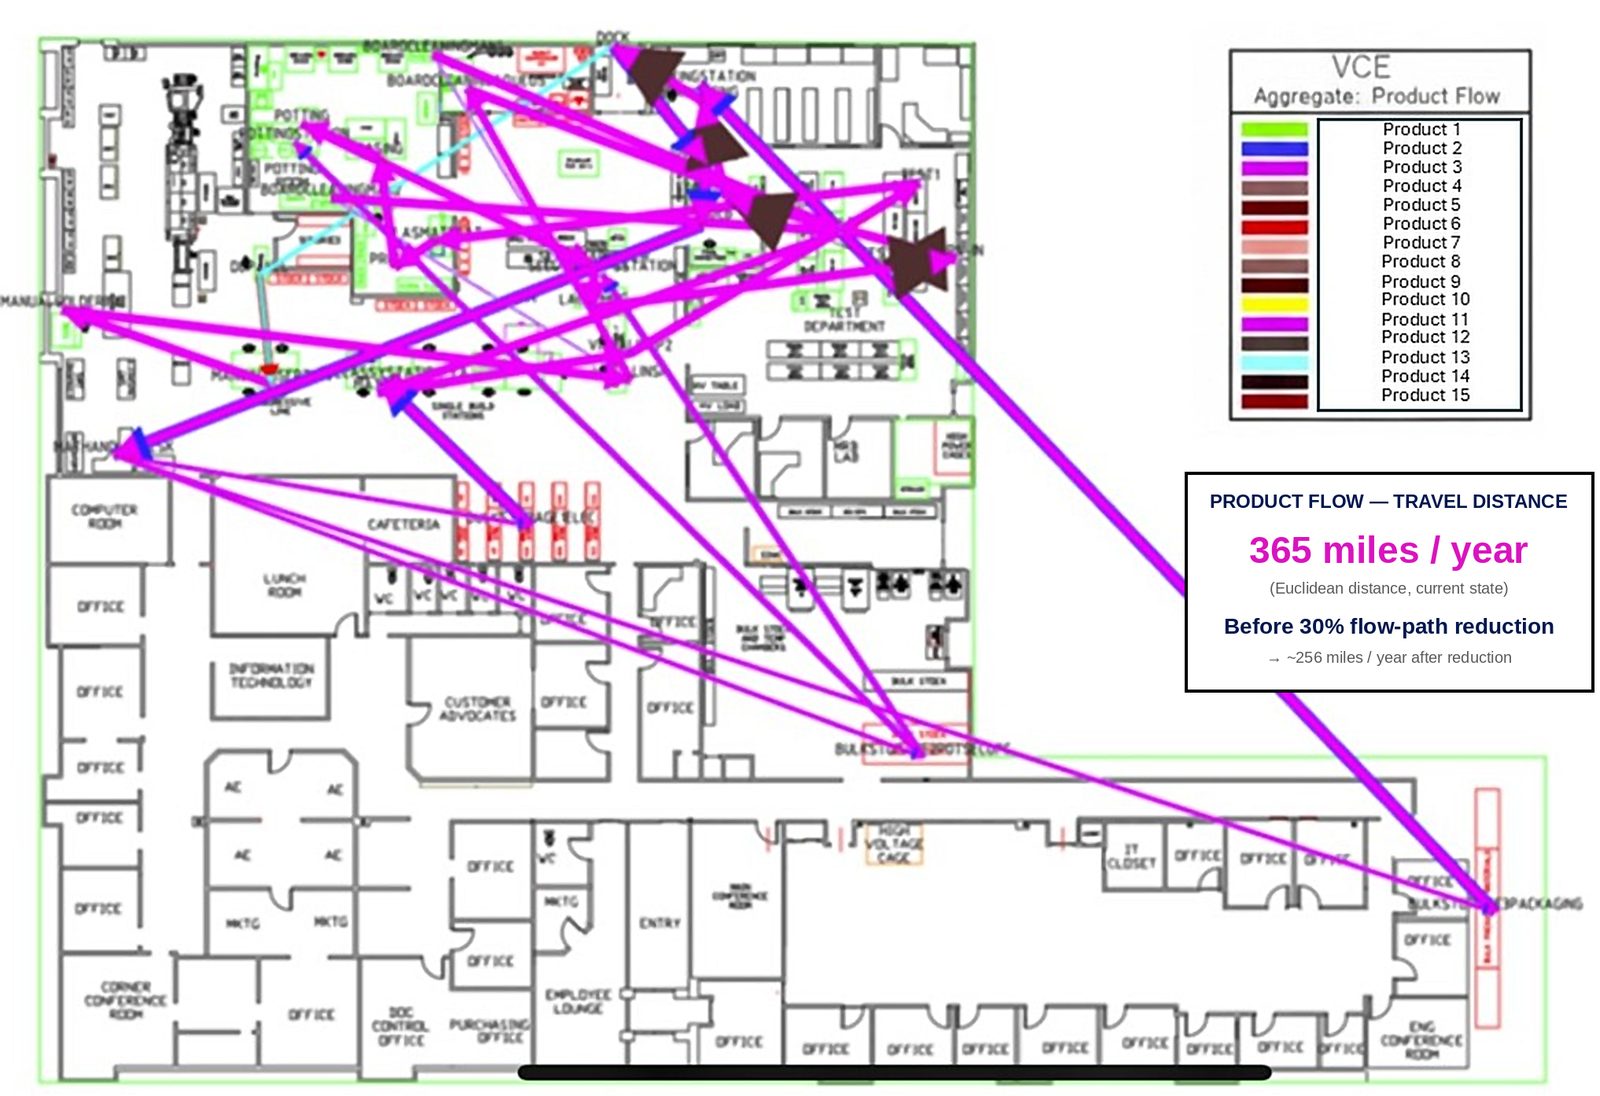
Aggregate flow for 15 product lines, with total travel distance calculated before and after a proposed flow-path reduction. Product and line names shown are illustrative placeholders; the underlying flow analysis is real.
365 miles/year of product travel mapped, cut to ~256 miles/year with a proposed 30% flow-path reductionEvery product and part traced through the facility, not simplified to an assumed path.
Aggregate and per-product travel distance, so improvement options can be compared on real numbers.
Specific flow-path changes ranked by impact, with before-and-after distance calculated for each.
Most engagements start with a quick conversation about where you are in the process.
Get In Touch