Understand how facility space is actually used and allocated, and how much of it supports revenue-generating work versus everything built around it.
Before drilling into how densely any one area is used, VCE classifies space at the site level by function: operations, building services, office, circulation, materials support, and more. That high-level view is the first checkpoint — it shows leadership what share of the footprint is actually production versus everything built around it, before any detailed space planning begins.
It sounds simple. It rarely is. Most facilities have never actually measured this — they know their total square footage, but not what fraction of it is generating revenue.
You suspect your current space isn't being used efficiently, or you're trying to decide whether to expand, consolidate, or reconfigure before committing capital.
| Site-level space metric | Sq Ft | % of GSF |
|---|---|---|
| Gross Square Feet (GSF) | 325,707 | — |
| Net Square Feet (NSF) | 279,785 | 86% |
| Operations Square Feet (OSF) | 162,506 | 50% |
| Non-Operations Square Feet (NOSF) | 117,279 | 36% |
From one anonymized client site. Only half of gross square footage on this site classified as true Operations Square Feet once building services, office, and circulation were accounted for.
Once the site-level picture is established, VCE narrows in on how densely equipment fills the operations space itself. Equipment Packing Density measures how much of your operations space is occupied by value-creating and revenue-generating equipment and processes, versus everything else around them.
Mapping it area by area shows where a facility is running efficiently and where capacity is being left on the table. Comparing areas against a target density turns square footage — an abstract number — into something leadership can actually act on.
Two facilities can report the same total square footage and have completely different amounts of real, revenue-generating capacity inside it. This is the number that tells you which one you have.
| Area | Equipment Footprint (SF) | Operations Space (SF) | EPD |
|---|---|---|---|
| Building A | 7,330 | 52,373 | 14% |
| Building B | 5,930 | 53,900 | 11% |
| Combined | 13,260 | 106,273 | 12% |
From one anonymized client site, target Equipment Packing Density set at 18%. Both buildings ran below target — meaning real, unused capacity was sitting inside space already being paid for.
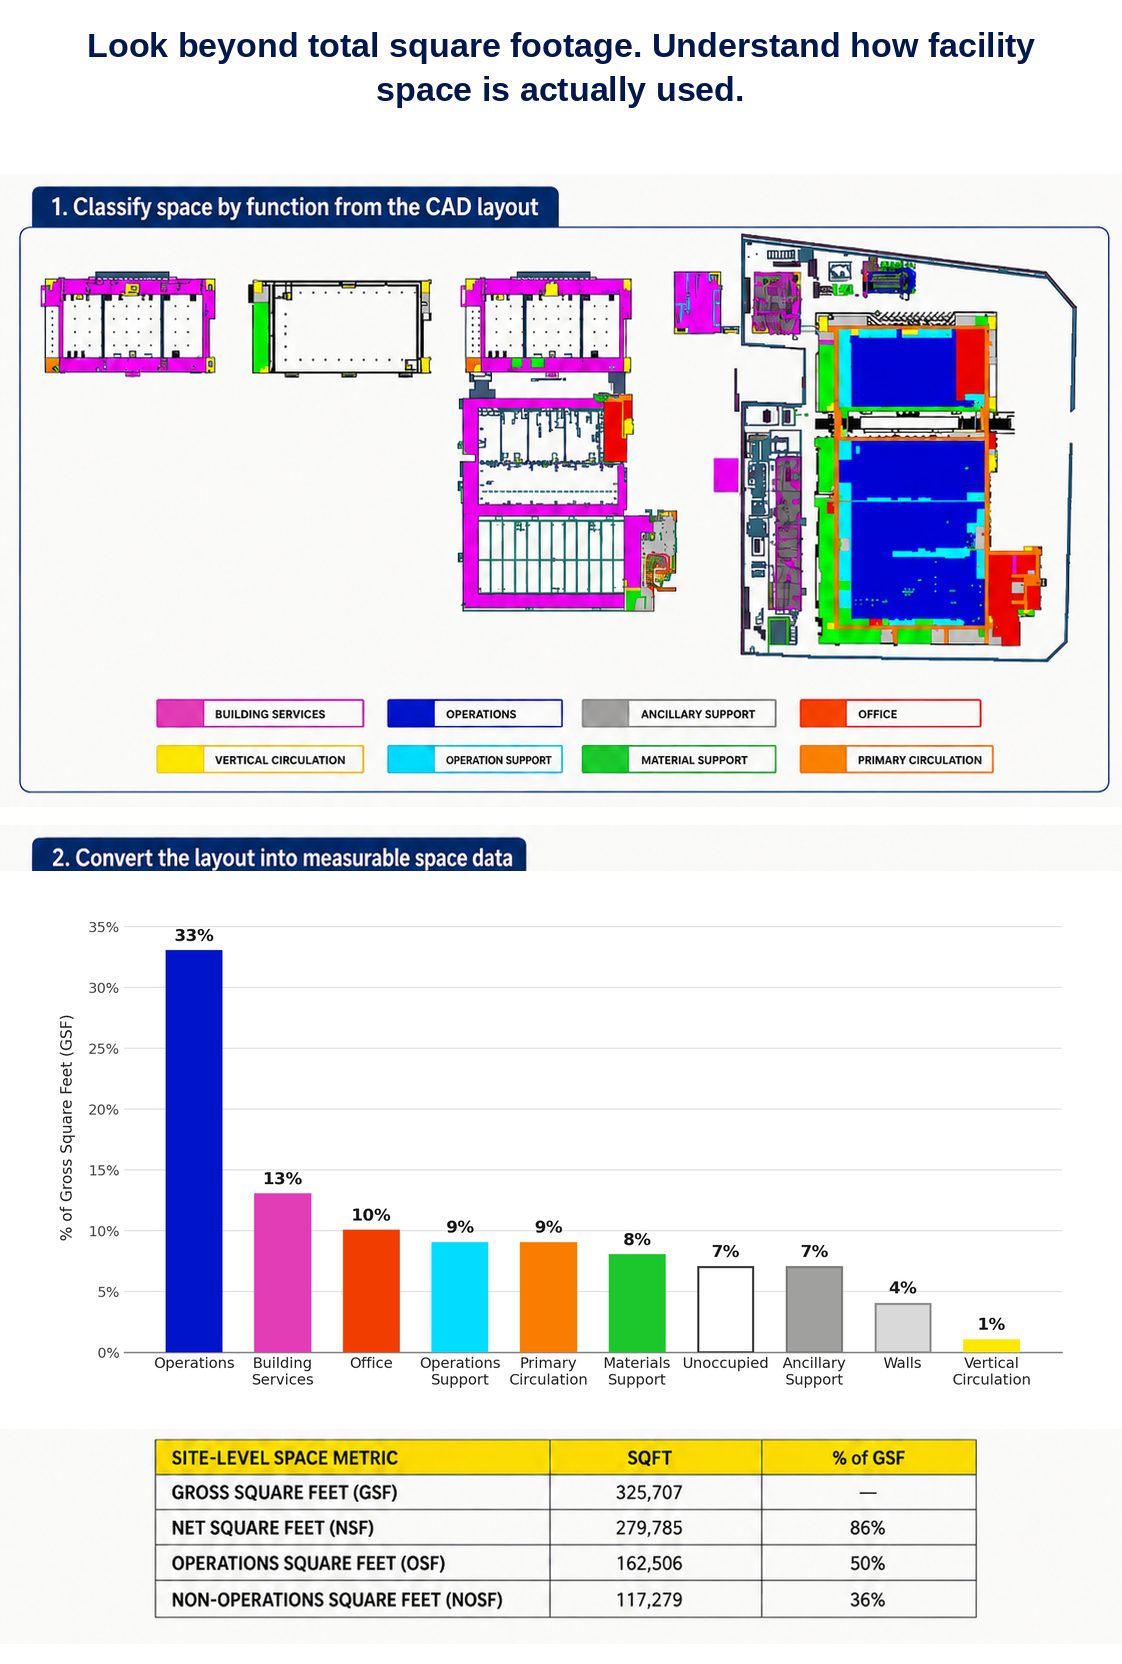
Space classified by function from the CAD layout (top), then converted into measurable percent-of-GSF data (bottom) — the same breakdown shown above, from the underlying analysis.
325,707 GSF analyzed — only 50% classified as true Operations Square Feet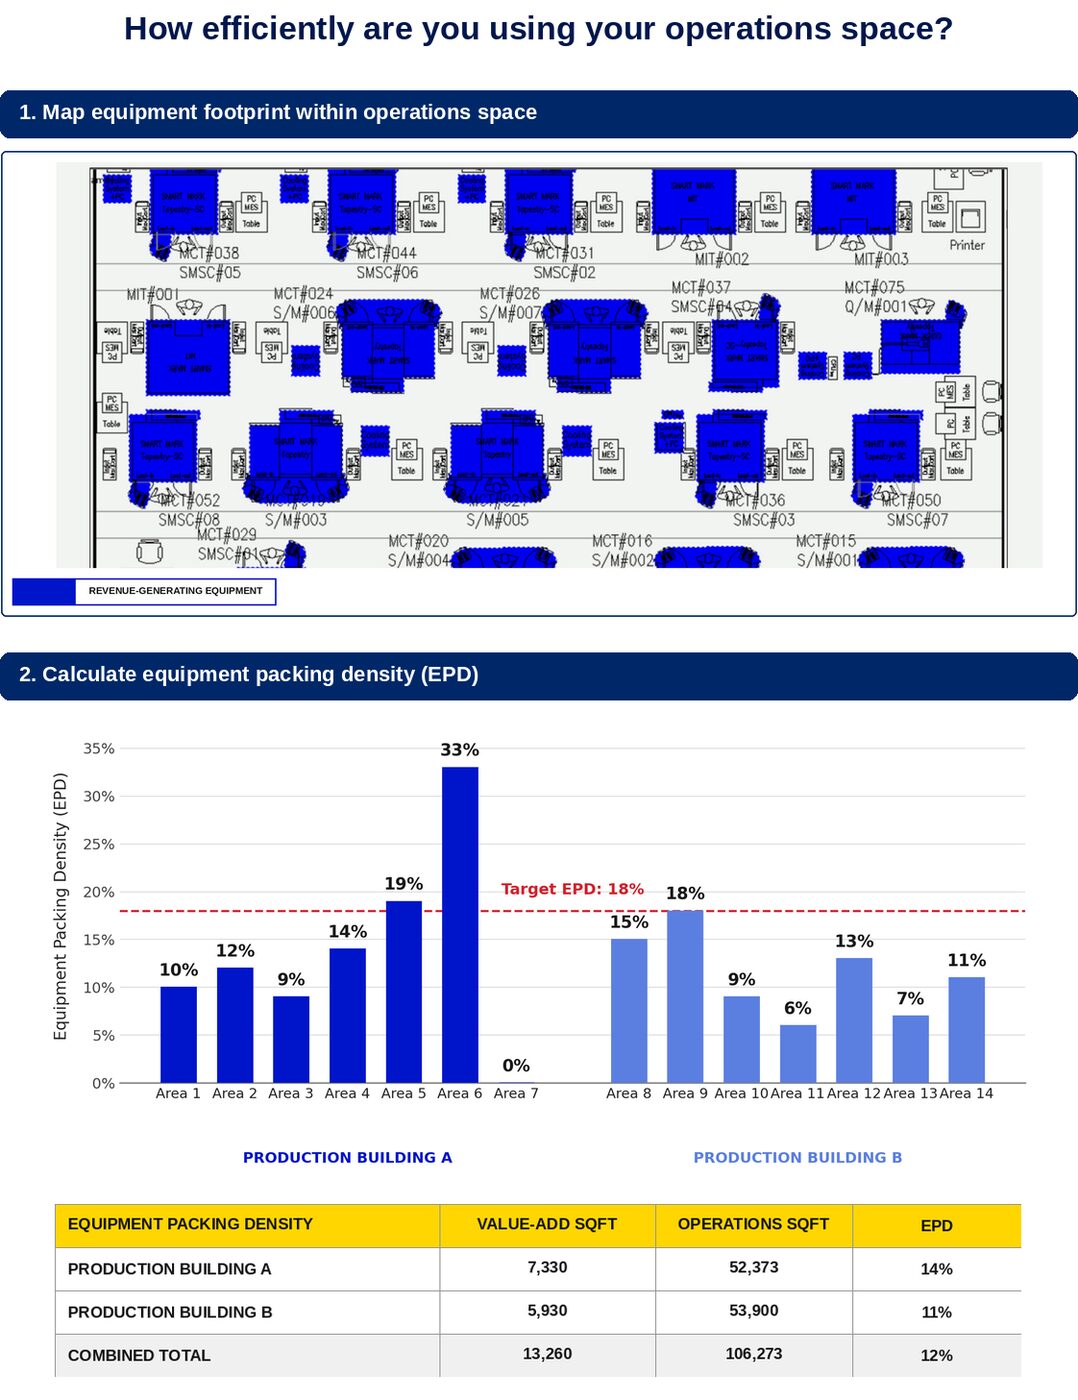
Equipment footprint mapped area by area (top) and compared against the 18% target density (bottom) — the underlying analysis behind the Building A / Building B numbers above.
Both buildings ran below the 18% target — real, paid-for space with room for more revenue-generating equipmentMost engagements start with a quick conversation about where you are in the process.
Get In Touch