You can't answer that by looking at a floor plan. Material flow analysis measures how materials and products actually move through a manufacturing facility — then models the change before it happens, so you know it's a real improvement, not a guess.
A team set out to re-layout half a factory. Every material movement for 200+ parts was traced across a full year before a single machine physically moved.
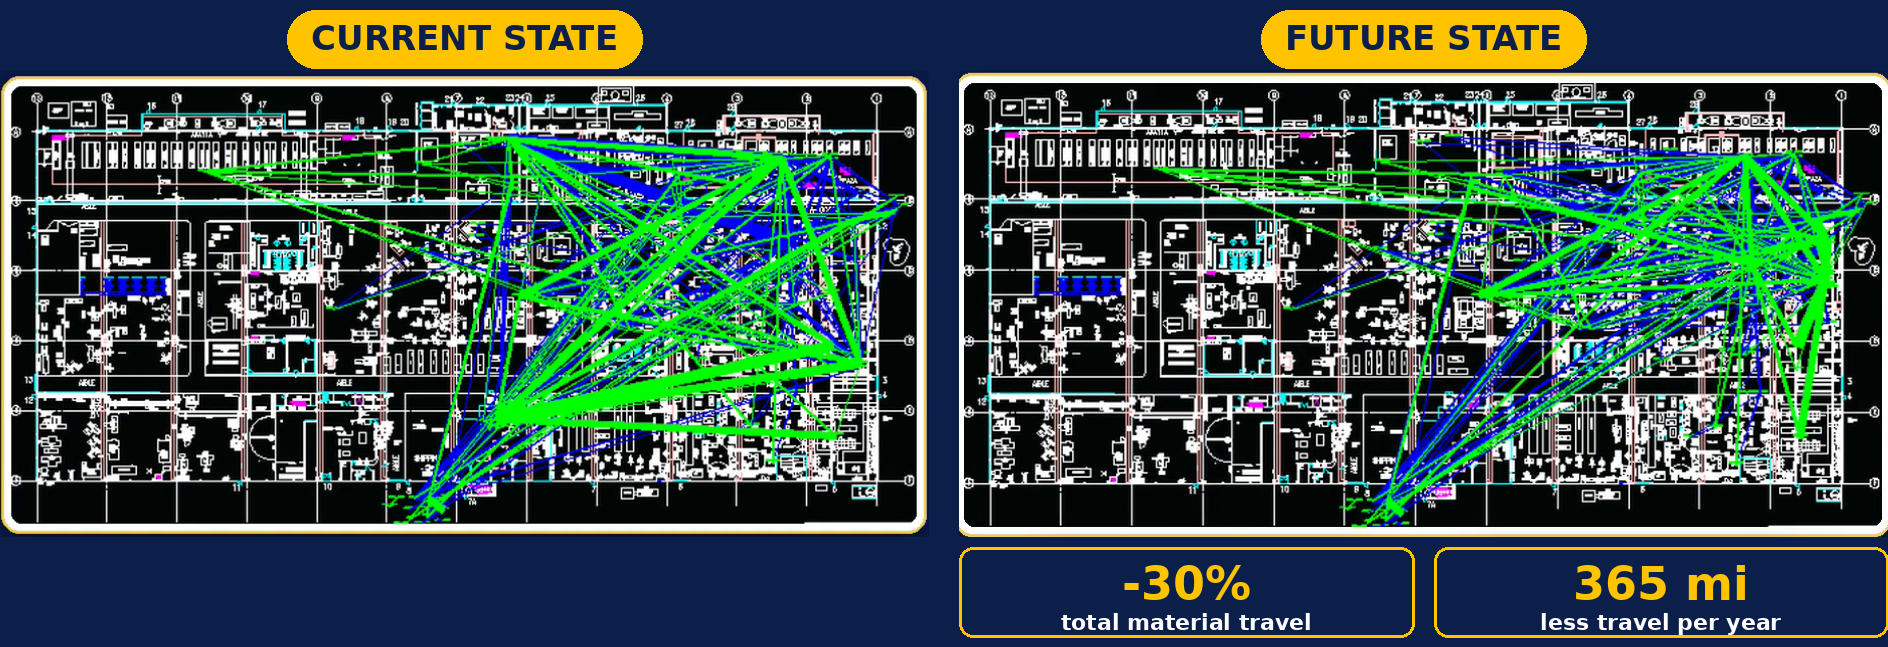
Same floor, same equipment — re-run around the flow that was actually measured. 30% less total material travel, 365 fewer miles traveled per year.
Material flow analysis is the measurement of how materials and products actually move through a manufacturing facility — real routes, real volumes, real travel distance — instead of how a floor plan assumes they move. This is facility and manufacturing material flow analysis: a production-floor engineering discipline, not fluid dynamics, not a financial cash-flow analysis, and not a software process-flow diagram.
Don't just draw layouts. Engineer them. Most people judge a layout by eye — does it look organized, does it feel efficient. The honest answer is: you can't know just by looking. A floor plan shows you where things sit. It doesn't show you how they flow, or where material handling travel and facility layout inefficiency are actually coming from.
That's the difference between drawing a layout and engineering one. It starts with the operating sequence and routing — the actual order of operations, branches, and shared resources, documented before anything gets measured — so flow is traced along the paths the operation really uses, not assumed. Once flow is actually mapped — not assumed — you can model a change before it happens, instead of finding out after the fact whether it worked.
That's what makes a change an actual improvement instead of a guess dressed up as one. The commercial layout tools VCE has used model departments, not full-facility movement down to every product, part, and person — so VCE built this material flow analysis capability in-house.
A semiconductor assembly area had grown into exactly the tangle you'd expect from years of incremental changes — equipment added where there was room, not where the product actually needed it. Mapping it in full showed lengthy, backtracking flow with no dedicated path by product. Regrouping the highest-volume products into three dedicated flow modules, based on what the map actually showed, is what turned it around.
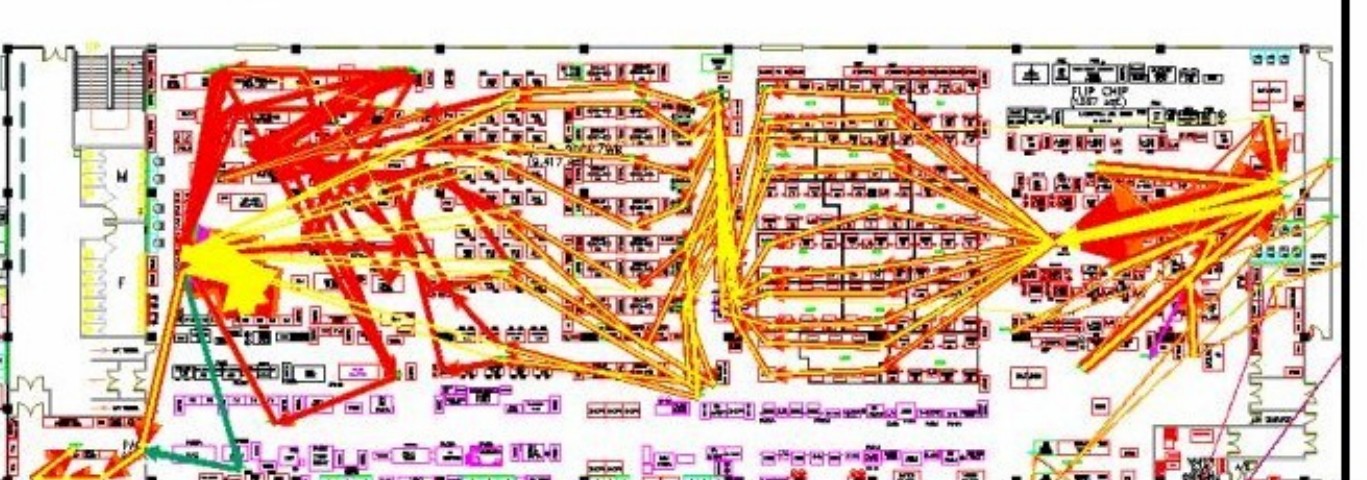
Current state: flow traced across the full area — long, backtracking, with no clear product-by-product path.
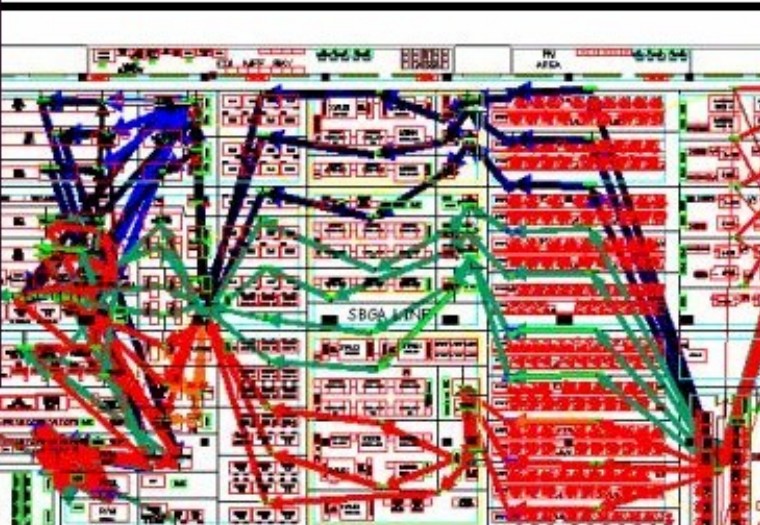
Future state: products grouped into three flow modules, based on the mapped movement rather than the existing floor plan.
The client had spent several years and a significant capital budget on layout changes without this kind of analysis. Once flow was actually mapped and redesigned around it: 35% less material-handling travel, $300,000+ in annual savings, 22% higher throughput, and 15% fewer material-handling defects.
At a large manufacturing facility, thousands of routings — every part, every trip, from dock to point of use — were mapped as straight-line paths across the full floor plan at once. Drawn all together, the pattern makes the problem impossible to miss: flow converging on a handful of points from every direction, instead of moving in an orderly line toward them. This was a convergence visualization, not a routed-distance calculation — a different technique from the path-traced method above, used here because the pattern it exposes is what matters most.
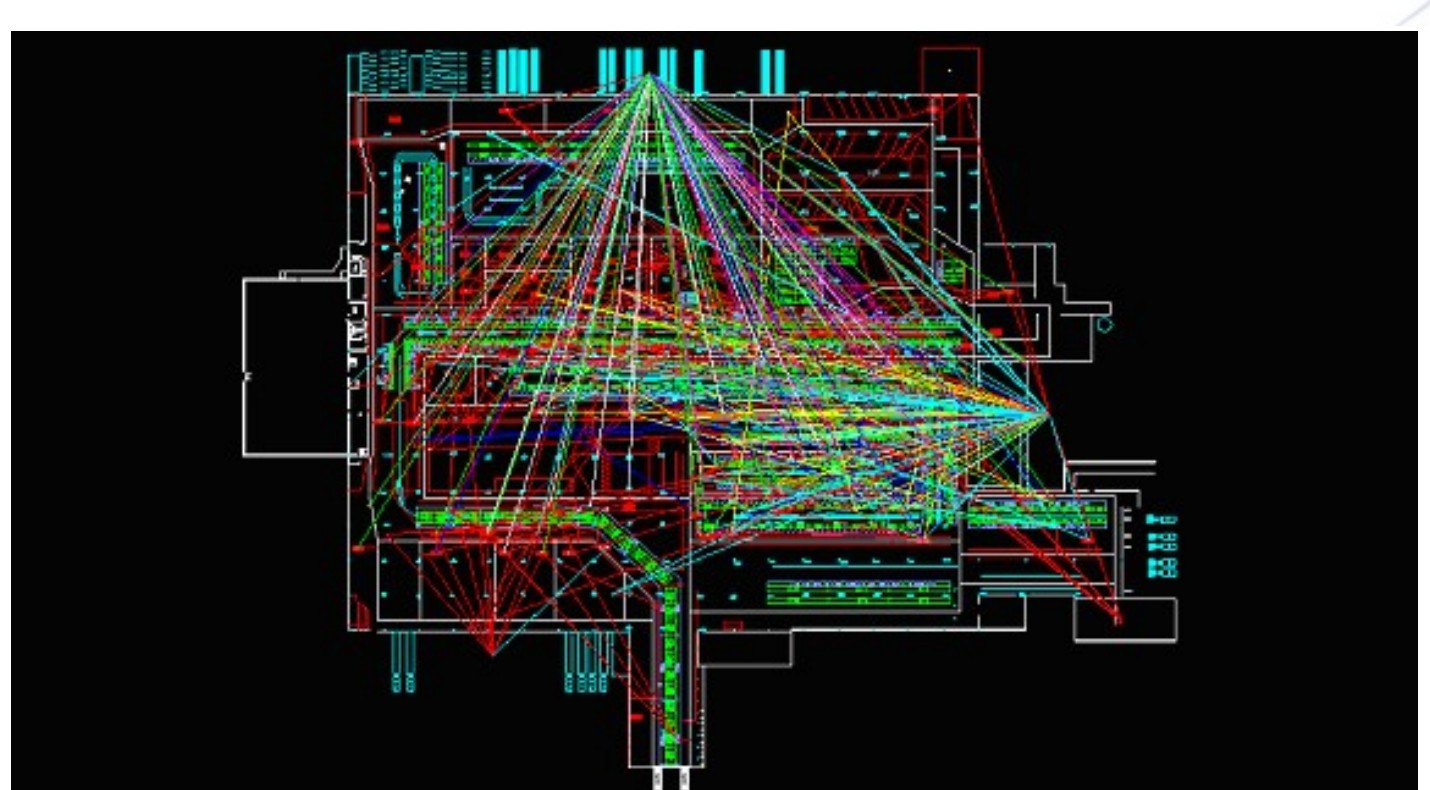
Every routing plotted as a straight line between its from- and to-locations — not simplified, not sampled, the full data set at once.
The resulting flow report put material handling cost at roughly $34,800 per 10 days of production, with forklift utilization below 40% — and showed that several parts could be received at a dock much closer to where they were actually used.
At an overseas assembly facility, one production line was assumed to run in a simple straight line — the kind of assumption that goes unquestioned for years because nobody's ever mapped it to check. Tracing the actual flow told a different story on both ends: the line itself, and the warehouse feeding it. No single number captures this one — the finding itself, visible in the maps below, is what mattered: an assumption the facility had been operating on for years turned out to be wrong.
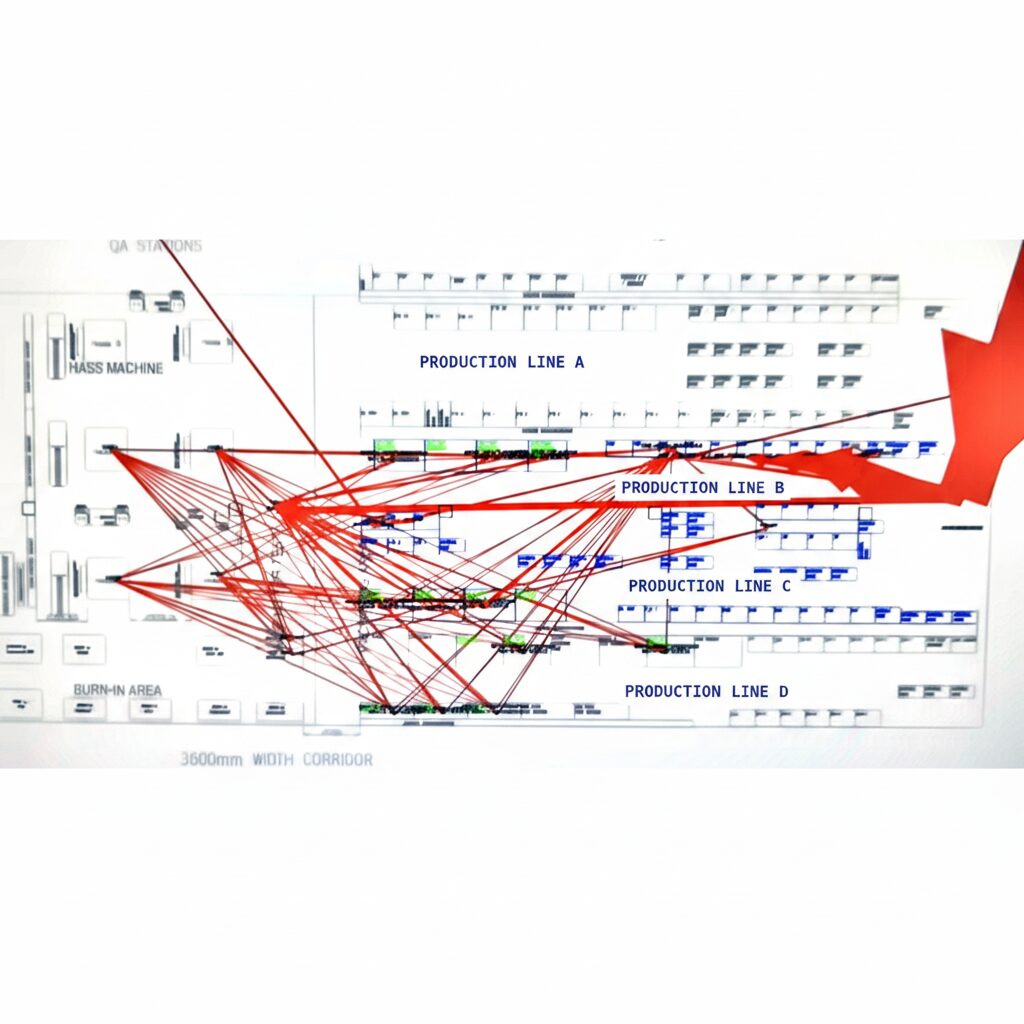
The line itself: assumed to run straight through — traced in full, it didn't.
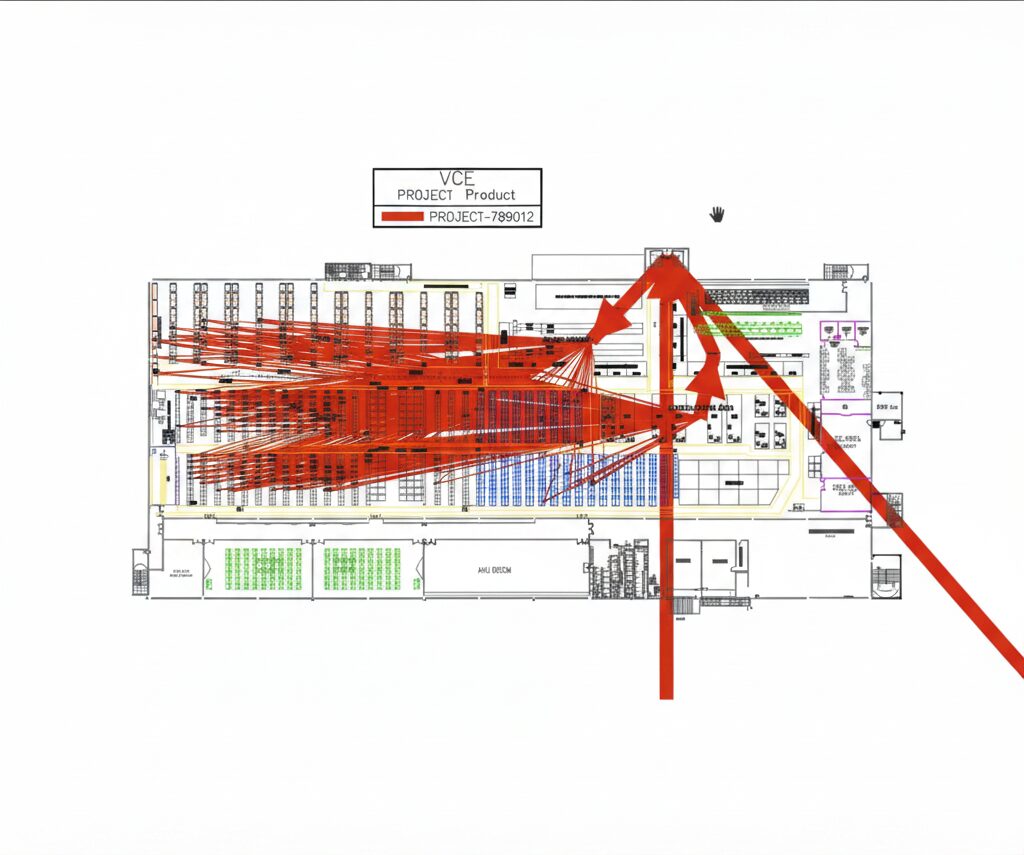
The warehouse behind it: that same product's parts, stored everywhere rather than staged for flow.
Every in-scope product and part traced through the manufacturing facility, not simplified to an assumed path.
Aggregate and per-product travel distance, so facility layout improvement options can be compared on real numbers.
Specific flow-path and material handling changes ranked by impact, with before-and-after distance calculated for each.
Most engagements start with a quick conversation about where you are in the process.
Get In Touch