Score your project's operational readiness before you fund it, using the same logic the Construction Industry Institute proved on $890 million of building projects.
By Robin Owens, Founder & Principal Engineer, Veritas Concept Engineering
CII research found a strong relationship between more complete scope definition and better cost and schedule performance. PDRI assesses that definition maturity before major commitments are made — built for industrial owners with project-controls staffs and engineering departments. Most building owners don't have that infrastructure. This framework is the translation.
A 32-project, $890 million validation study found that buildings scoring below 200 on CII's PDRI came in at roughly 1% over budget and 2% behind schedule, while buildings scoring above 200 came in at roughly 6% over budget and 11% behind schedule. Real research, real numbers, real direction of effect.
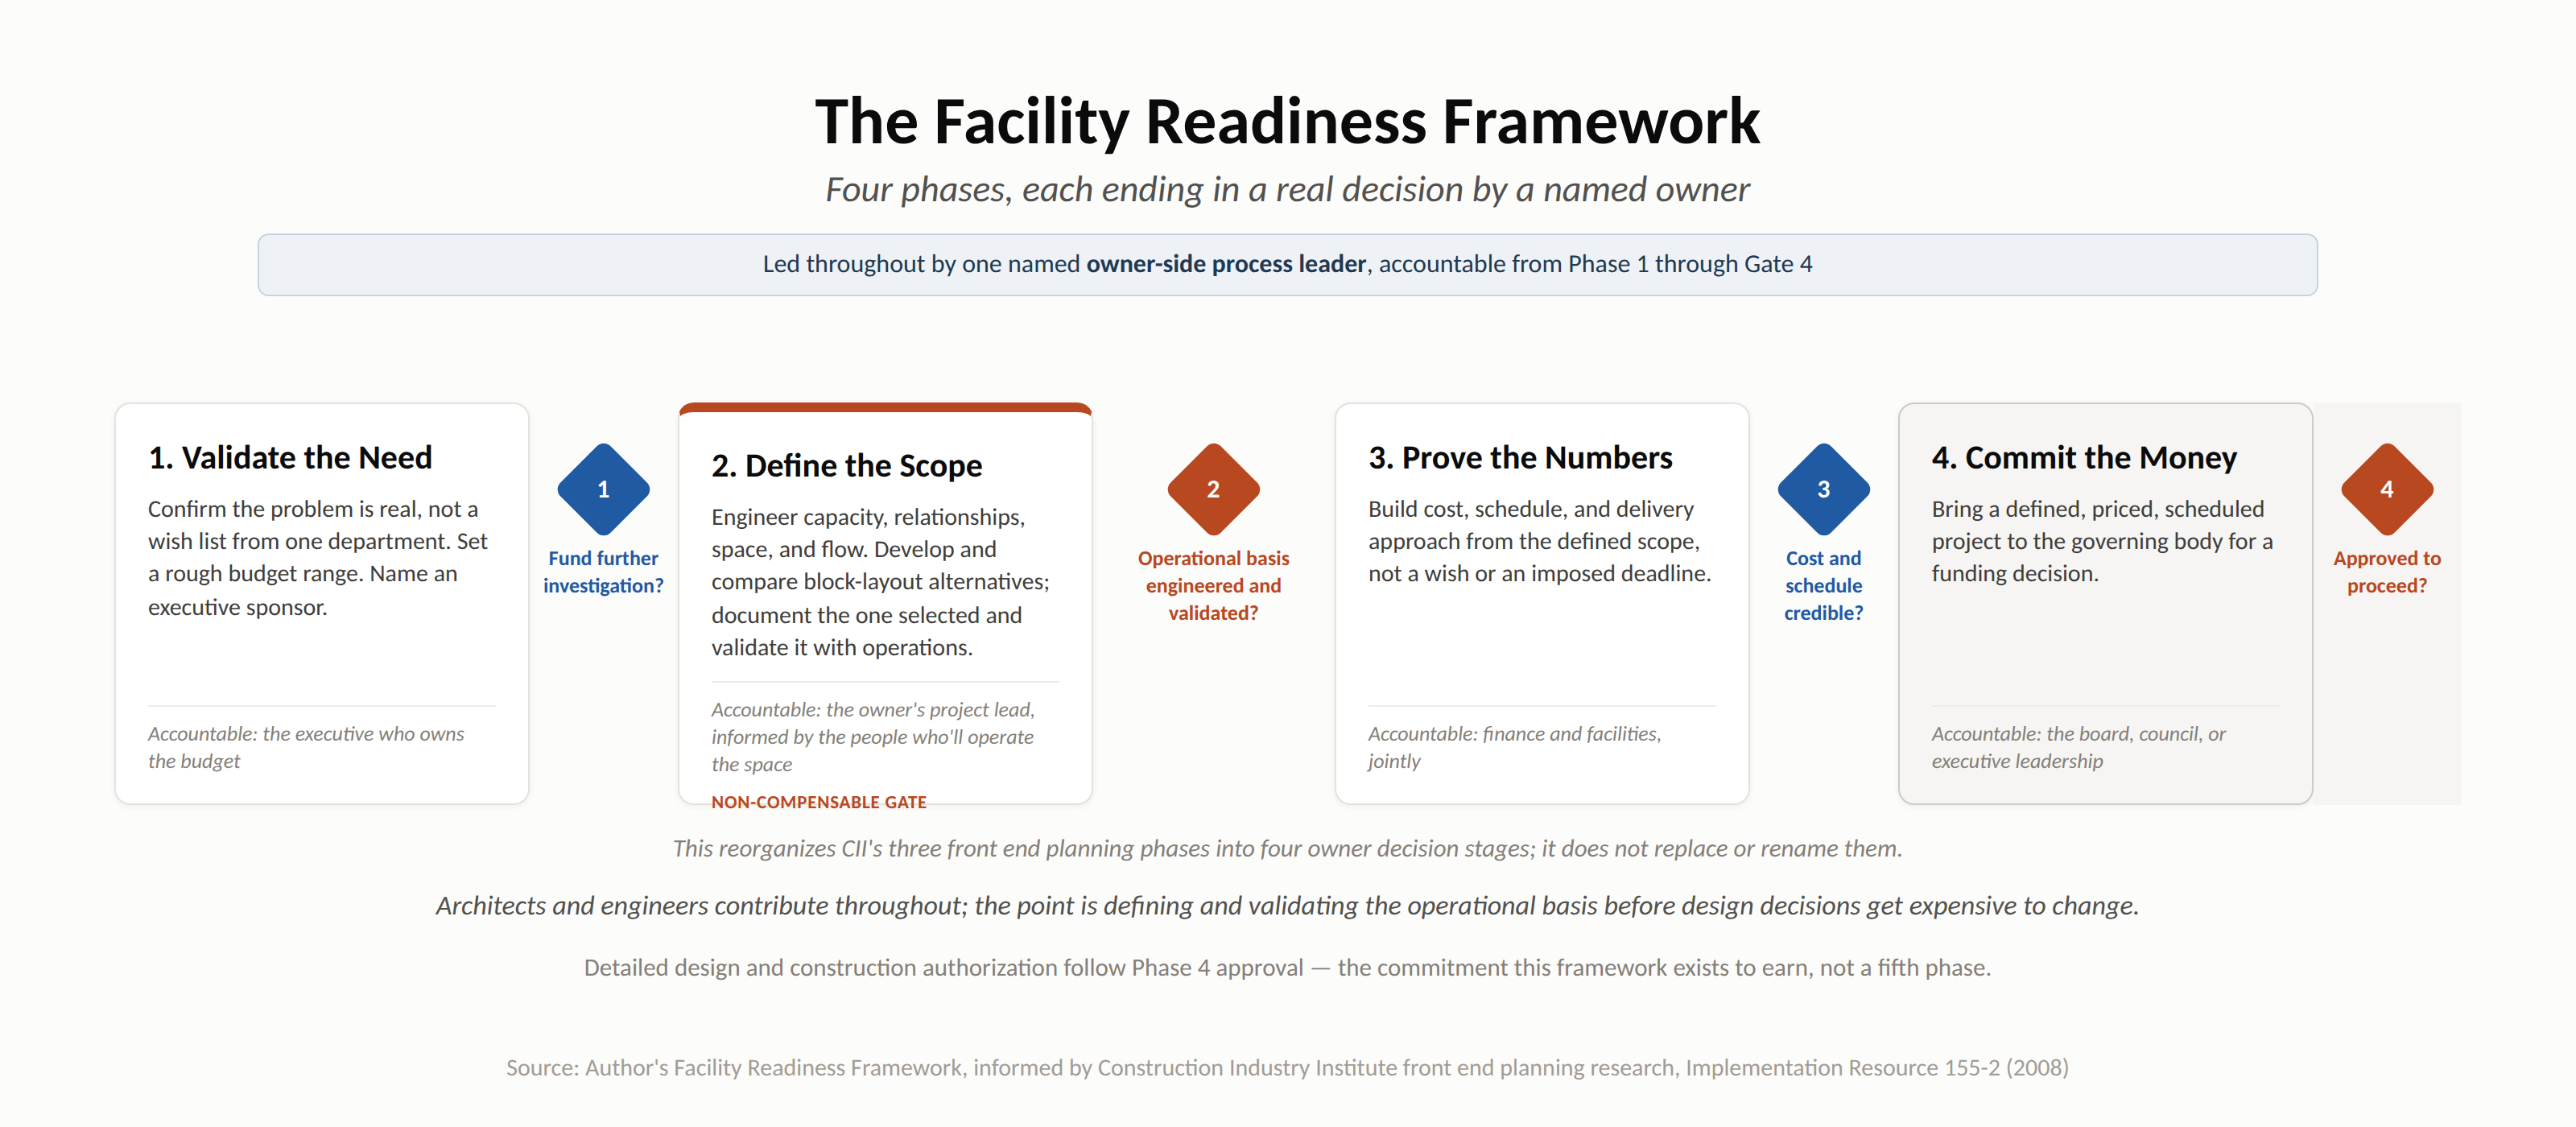
The Facility Readiness Framework compresses industrial-grade front-end planning discipline into four phases — the minimum number that still catches the failure mode that actually sinks building projects: jumping from “we need more space” straight into design and construction documents, skipping over decisions that were knowable, and cheap to make, much earlier.
Phase 2 carries a rule the others don't: it's non-compensable. A strong business case, a credible budget, a complete schedule, and a sound procurement strategy cannot offset an operation that hasn't been engineered. No score anywhere else in the framework can override that gate.
I want to be upfront about what this is and isn't. It's new. I built it. It hasn't been tested against 32 completed projects the way PDRI has — no instrument gets to claim that kind of proof on day one, and I'm not going to pretend otherwise. What I can tell you is that it's built on the same relationship CII's research found between scope-definition maturity and project performance, structured to behave the same way, and I intend to score real projects against the Facility Readiness Score and publish what actually happens — including if something needs to change.
The Facility Readiness Framework, built to put this sequence to work on your own project, is available below. Download it, change it to fit how your organization actually makes capital decisions, and use it.
⇩ Download the Full Framework Overview (.docx)
That's the overview document alone. Need the whole toolkit — every phase's guides, worked examples, and forms, plus the FRS workbook — pick individual pieces below, or grab the complete ZIP from the button at the top of this page.
Every phase ships the same four kinds of document: a one-page Visual Overview, a Facilitator Guide for whoever runs the phase, a Worked Example showing the forms filled out for a sample project, and the Forms themselves, numbered in the order you'll actually use them.
“Should we even spend money investigating this?”
Accountable: The executive who owns the budget — CFO, superintendent, CEO
“Has the operational basis actually been engineered and validated?”
Accountable: The owner's project lead, informed by the people who'll operate the space
“Is the cost and schedule credible?”
Accountable: Finance and facilities, jointly
“Are we ready to commit full construction funding?”
Accountable: The governing body with authority to commit the money
Modeled on CII's Project Definition Rating Index (PDRI), whose research found a strong relationship between scope-definition maturity and project performance — an original instrument, not a derivative of CII's proprietary categories or scoring sheets, built for building owners who don't have an industrial project-controls staff behind them.
Eight categories, 30 elements, rated against specific evidence — not a feeling — and rolled up into a single score out of 100.
| Category | Max Points |
|---|---|
| Business Case & Funding Clarity Typically led by: executive sponsor / CFO |
12 |
| Stakeholder Governance & Decision Rights Typically led by: project lead / facilities director |
8 |
| Capacity, Layout & Flow Validation Non-compensable Typically led by: industrial engineer, operations engineer, or facilities planner |
22 |
| Site & Physical/Regulatory Constraints Typically led by: civil/site engineer, code & permitting consultant |
10 |
| Budget Basis & Cost Realism Typically led by: cost estimator, CFO/finance |
15 |
| Schedule Realism & Sequencing Typically led by: construction manager / scheduler / GC |
10 |
| Risk & Approval Readiness Typically led by: project lead, legal/regulatory advisor |
9 |
| Delivery & Procurement Strategy Typically led by: project lead, procurement/legal |
14 |
| Total Facility Readiness Score | 100 |
The Capacity, Layout & Flow Validation category is also where Veritas Concept Engineering's own practice sits — if you'd like outside help scoring or strengthening that category before Gate 3, let's talk.
Each element is rated on a simple four-point scale — Not Started, Identified, Drafted, Confirmed & Documented — and that rating converts into points against the element's weight. Higher is better. The score is calculated once, at the end of Phase 3, immediately before the Gate 3 review — then reconfirmed (not recalculated) at Gate 4, unless something material changed, in which case that work goes back to its source phase first.
Required definition is substantially complete. Bring it to the Gate 3 review — the gate authority still determines whether the project proceeds.
Material definition gaps remain. Close them before Gate 3; any exception must be explicitly documented and approved, not a quiet pass.
Substantial definition gaps remain.
I want to say this plainly, without hedging: the Facility Readiness Score and its category weights are this author's own provisional allocation. Unlike CII's PDRI threshold, it hasn't yet developed its own outcome record. I intend to score real projects against it and publish what actually happens, calibrating the weights and bands in public if the data says they need to move. Treat it as a transparent diagnostic, not a validated predictor, until that record exists.
The framework and score are free to use on your own. If you'd rather have an engineer run it with you, that's a conversation away.
Get In Touch